Daily Market Analysis By FXOpen
Dear Forum Members!
Here you can find Daily Market Analysis of Forex, Cryptocurrency, Indexes, Metals, Oil and others.
We hope that this information will be helpful for your trading.
Best Regards
FXOpen Team
GBP/USD Faces Resistance While EUR/GBP Eyes More Gains
GBP/USD started a fresh increase above the 1.2150 resistance. EUR/GBP is showing positive signs above the 0.8550 resistance zone.
Important Takeaways for GBP/USD and EUR/GBP
The British Pound started a decent increase above 1.2150 against the US Dollar.
There was a break below a key bullish trend line with support near 1.2220 on the hourly chart of GBP/USD.
EUR/GBP is holding the 0.8580 support but struggling above 0.8600.
There is a major bullish trend line forming with support near 0.8570 on the hourly chart.
GBP/USD Technical Analysis
The British Pound remained well bid above the 1.1920 zone against the US Dollar. The GBP/USD pair started a decent increase after it broke the 1.2000 resistance.
There was a clear move above the 1.2100 level and the 50 hourly simple moving average. The bulls were even able to clear the 1.2150 resistance. However, the pair struggled near the 1.2400 resistance and started a downside correction.
GBP/USD Hourly Chart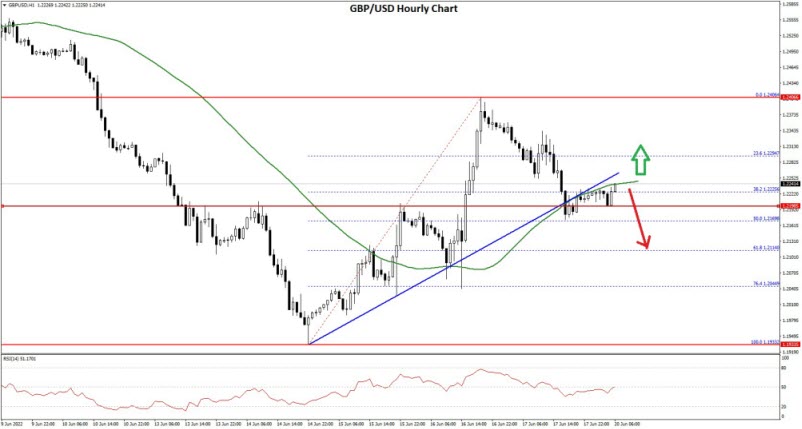
There was a break below a key bullish trend line with support near 1.2220 on the hourly chart of GBP/USD. The pair traded below the 38.2% Fib retracement level of the upward move from the 1.1933 swing low to 1.2406 high.
The pair tested the 50% Fib retracement level of the upward move from the 1.1933 swing low to 1.2406 high. It is now rising and trading above the 1.2240 level.
On the upside, an initial resistance is near the 1.2280 level. The next main resistance is near the 1.2320 zone. A clear upside break above the 1.2320 and 1.2330 resistance levels could open the doors for a steady increase in the near term. The next major resistance sits near the 1.2400 level.
If not, the pair might start a fresh decline below 1.2180. The next major support is near the 1.2150 level. Any more losses could lead the pair towards the 1.2050 support zone or even 1.2020.
Read Full on FXOpen Company Blog...
BTCUSD and XRPUSD Technical Analysis – 21st JUNE 2022
BTCUSD – Rounding Bottom Pattern Above $17600
Bitcoin was unable to sustain its bearish momentum and after touching a low of 17678 on 18th June started to correct upwards and is now trading above $21000 handle in the European Trading session.
We can see that after touching an 18-month low the prices of Bitcoin have pulled back due to the buying seen at lower levels from the long-term investors.
Bitcoin entered into a Consolidation channel above the $18000 handle and continues to rise above these levels.
The Global demands for Bitcoin have improved now and the prices are expected to cross $22000 levels.
We can clearly see a Rounding Bottom Pattern Above the $17600 handle which is a Bullish reversal pattern because it signifies the end of a Downtrend and a shift towards an Uptrend.
Both the STOCH and STOCHRSI are indicating Overbought levels which means that in the immediate short term a decline in the prices is expected.
Relative Strength Index is at 66 indicating a STRONGER demand for the Bitcoin at the current market levels.
Bitcoin is now moving Above its 100 hourly Simple Moving average and its 200 hourly Simple Moving averages.
All of the Major Technical Indicators are giving a STRONG BUY Signal, which means that in the immediate short term we are expecting targets of 22000 and 23500.
Average True Range is indicating LESS Market Volatility with a Strong Bullish Momentum.
Bitcoin Bullish Reversal seen Above $17600.
Williams Percent Range is Indicating OVERBOUGHT Levels.
The price is now trading just Above its Pivot Levels of $21263.
All of the Moving Averages are giving a STRONG BUY market signal.
Bitcoin Bullish Reversal Seen Above $17600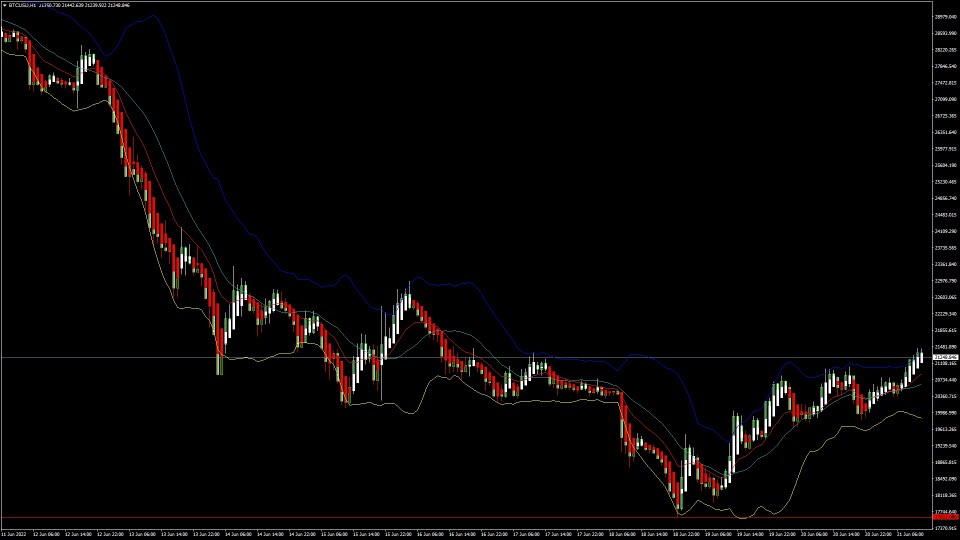
The prices of Bitcoin have entered into a consolidation channel above the $18000 handle and the pullback seen is expected to continue touching levels of $22000.
We can see the formation of a Rising Trend channel above the $18000 handle and now we are looking at the projected levels of $22000 and $24000.
The immediate short-term outlook for Bitcoin is Strong Bullish, Medium-term outlook has turned as Bullish, and the long-term outlook remains Neutral under present market conditions.
Bitcoin continues to consolidate above its important support levels of $21000 and further appreciation in its prices is expected in the US Trading session.
The price of BTCUSD is now facing its Classic resistance levels of 21486 and Fibonacci resistance levels of 21633 after which the path towards 22000 will get cleared.
In the last 24hrs BTCUSD has increased by 3.43% by 705$ and has a 24hr trading volume of USD 32.005 Billion. We can see a Decrease of 12.38% in the Trading volume as compared to yesterday, which is due to the buying by the long-term investors.
The Week Ahead
The prices of Bitcoin are moving in a Strong Bullish momentum and the immediate targets are $22000 and $23500
The Daily RSI is printing at 31 which means that the medium range demand continues to be WEAK.
We can see that the prices of Bitcoin have stabilized above the $21000 handle and now we are looking at the important support levels of $21237 and $21305.
The prices of BTCUSD will need to remain above the important support levels of $21000 this week.
Weekly outlook is projected at $22500 with a consolidation zone of $21000.
Technical Indicators:
Moving Averages Convergence Divergence (12,26): It is at 279 indicating a BUY.
Ultimate Oscillator: It is at 64.37 indicating a BUY.
Rate of Price Change: It is at 5.69 indicating a BUY.
Commodity Channel Index(14days): It is at 171.10 indicating a BUY.
Read Full on FXOpen Company Blog...
EUR/USD Could Rise, USD/JPY Remains In Strong Uptrend
EUR/USD struggled near 1.0580 and corrected lower. USD/JPY is rising and might continue to gain pace towards the 138.00 resistance
Important Takeaways for EUR/USD and USD/JPY
The Euro started a downside correction after it failed to surpass 1.0580.
There is a key bullish trend line forming with support near 1.0505 on the hourly chart of EUR/USD.
USD/JPY gained pace after it broke the 135.00 resistance zone.
It surpassed a major bearish trend line with resistance near 135.35 on the hourly chart.
EUR/USD Technical Analysis
This past week, the Euro started a decent recovery wave above the 1.0500 level against the US Dollar. The EUR/USD pair cleared the 1.0520 and 1.0550 resistance levels.
However, the pair faced sellers near the 1.0580 level. A high was formed near 1.0582 on FXOpen and EUR/USD started a downside correction. There was a move below the 1.0520 support and the 50 hourly simple moving average.
EUR/USD Hourly Chart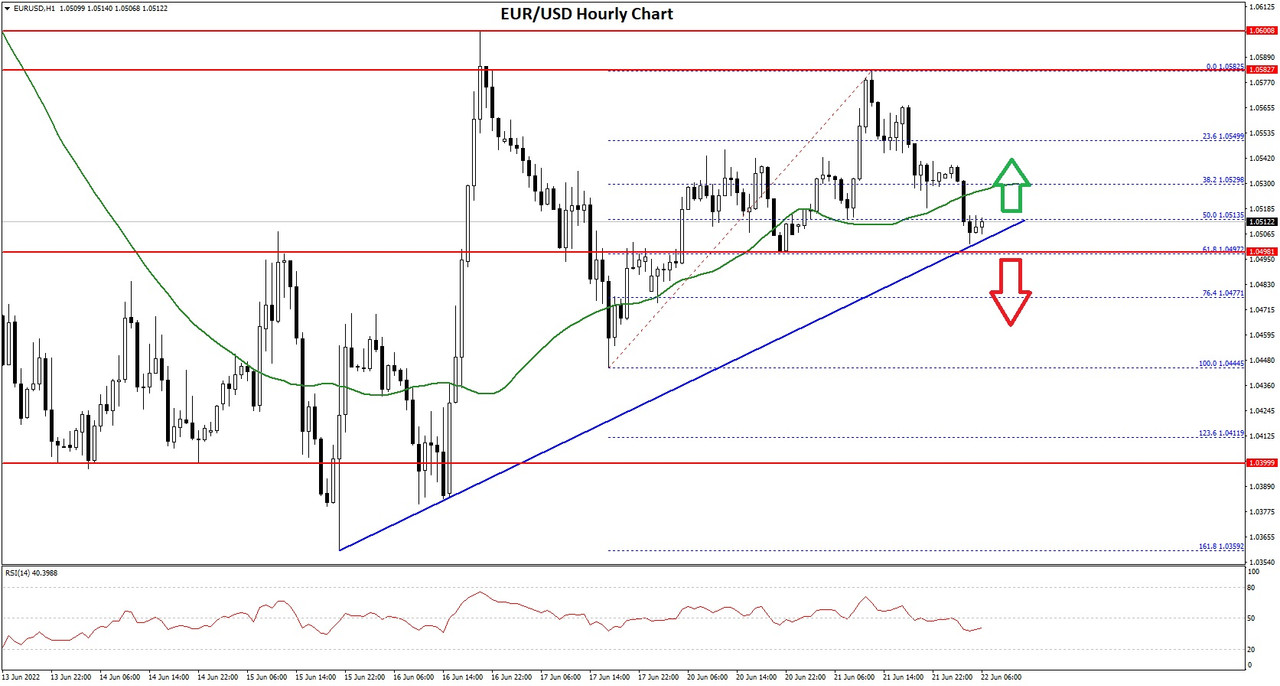
The pair even spiked below the 50% Fib retracement level of the upward move from the 1.0444 swing low to 1.0582 high. However, the bulls are now protecting the 1.0500 support zone.
There is also a key bullish trend line forming with support near 1.0505 on the hourly chart of EUR/USD. The trend line is close to the 61.8% Fib retracement level of the upward move from the 1.0444 swing low to 1.0582 high.
An immediate resistance on the upside is near the 1.0530 level the 50 hourly simple moving average. The next major resistance is near the 1.0550 level. The main resistance is near the 1.0580 level. An upside break above 1.0580 could set the pace for a steady increase.
If not, the pair might drop and test the 1.0480 support. The next major support is near 1.0450, below which the pair could drop to 1.0400 in the near term.
Read Full on FXOpen Company Blog...
ETHUSD and LTCUSD Technical Analysis – 23rd JUNE, 2022
ETHUSD – Bullish Harami Pattern Above $936
Ethereum was unable to sustain its bearish momentum and after touching a low 893 on 18th June started to correct upwards against the US Dollar.
We can see that the prices have recovered from its lows and a pullback action is seen at levels below $1000.
We can see the formation of a Bullish Ascending channel below the $1000 handle and now we are looking at $1100 and $1250 as the immediate targets.
The prices touched an Intraday Low of $1046 in the Asian Trading session and an Intraday High of $1107 in the European Trading session today.
We can clearly see a Bullish Harami Pattern Above the $936 handle which is a Bullish pattern and signifies the end of a Bearish phase and the start of a Bullish phase in the markets.
ETH is now trading above its Pivot levels of 1096 and is moving into a Strong Bullish channel. The price of ETHUSD is now testing its Classic resistance levels of 1101 and Fibonacci resistance levels of 1110 after which the path towards 1200 will get cleared.
Relative Strength Index is at 52 indicating a NEUTRAL market and the shift towards the consolidation phase in the markets.
Both the STOCHRSI and Williams Percent Range are indicating Overbought levels, which means that the prices are due to correct downwards in the short-term range.
ALL of the of the Technical indicators are giving a STRONG BUY market Signal.
Most of the Moving Averages are giving a BUY Signal and we are now looking at the levels of $1100 to $1250 in the short-term range.
ETH is now trading Above its both the 100 Hourly Simple and Exponential Moving Averages.
Ether Bullish Reversal seen Above the $936 mark.
Short-term range appears to be Strongly BULLISH.
ETH is poised for an upwards Rally against the US Dollar.
Average True Range is indicating LESS Market Volatility.
Ether Bullish Reversal Seen Above $936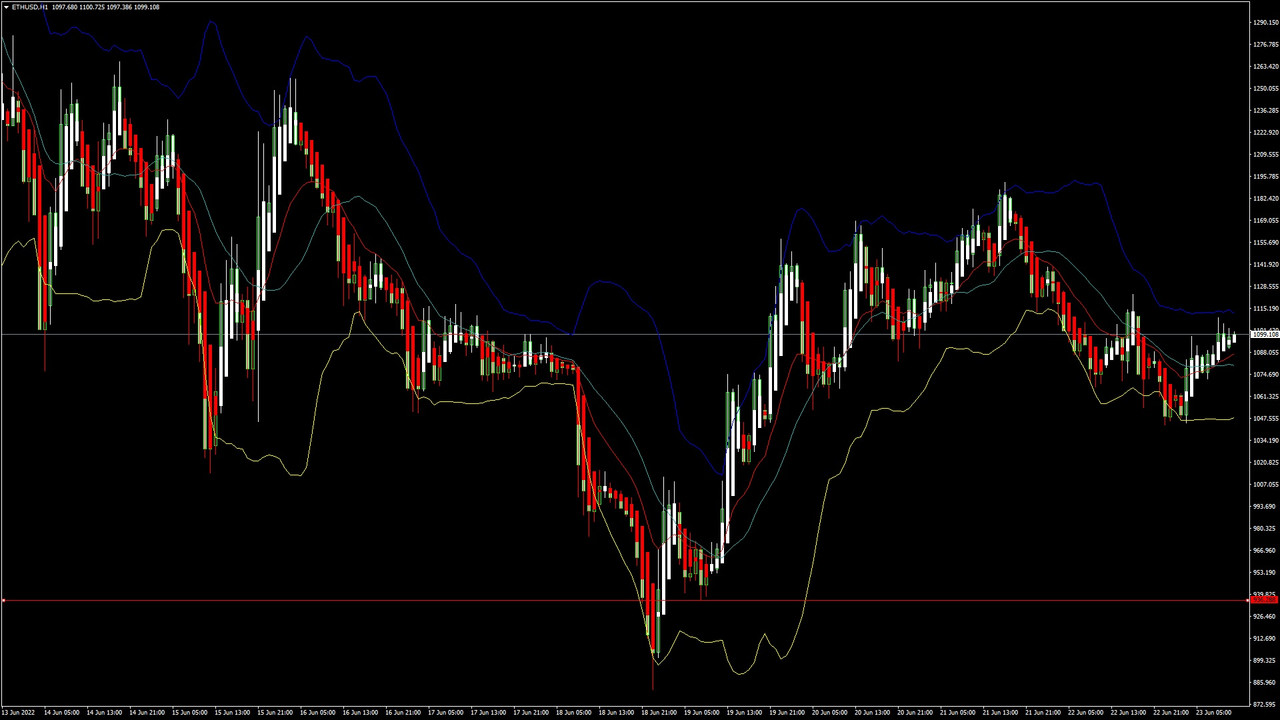
ETHUSD is now moving into a Strong Bullish Channel with the prices trading above the $1100 handle in the European Trading session today.
The On Balance Volume is indicating that the demand from the buyers and sellers is in equilibrium, meaning that the present prices of Ether are moving into a consolidation phase.
Now we are looking at the possibility of a Rally into the markets which could push the prices of Ether above the $1500 levels soon.
The key resistance levels to watch are $1275 and $1300 and the prices of ETHUSD need to cross these levels for the continuation of the Bullish reversal.
ETH has increased by 1.50% with a price change of 16$ in the past 24hrs and has a trading volume of 14.913 Billion USD.
We can see an Increase of 3.86% in the total trading volume in last 24 hrs. which appears to be Normal.
The Week Ahead
The global investor sentiments have improved as we can see a recovery of almost 30% from a low of $893 to a high of $1189 reached yesterday.
The prices of Ethereum continue to remain above the important psychological support levels of $1000 and we can witness an upwards Rally into the markets in the next week.
The immediate short-term outlook for the Ether has turned as Strongly BULLISH, the medium-term outlook has turned NEUTRAL, and the long-term outlook for Ether is NEUTRAL in present market conditions.
In this week Ether is expected to move in a range between the $1100 and $1250 and in the next week Ether is expected to enter into a Consolidation phase above the $1250 levels.
Technical Indicators:
STOCH (9,6): It is at 76.59 indicating a BUY.
Average Directional Change(14days): It is at 23.69 indicating a BUY.
Rate of Price Change: It is at 3.61 indicating a BUY.
Commodity Channel Index(14days): It is at 129.70 indicating a BUY.
Read Full on FXOpen Company Blog...
Gold Price and Oil Price Could Extend Losses
Gold price is struggling below the $1,850 resistance zone. Crude oil price is declining and might even trade below the $100 support zone.
Important Takeaways for Gold and Oil
Gold price struggled above $1,850 and corrected lower against the US Dollar.
There was a break below a key bullish trend line with support near $1,825 on the hourly chart of gold.
Crude oil price started a downside correction from the $116 and $118 resistance levels.
There is a major bearish trend line forming with resistance near $104.00 on the hourly chart of XTI/USD.
Gold Price Technical Analysis
Gold price struggled to gain pace above the $1,850 resistance zone against the US Dollar. The price started a fresh decline and traded below the $1,840 pivot level.
There was a clear move below the $1,825 support zone and the 50 hourly simple moving average. Besides, there was a break below a key bullish trend line with support near $1,825 on the hourly chart of gold.
Gold Price Hourly Chart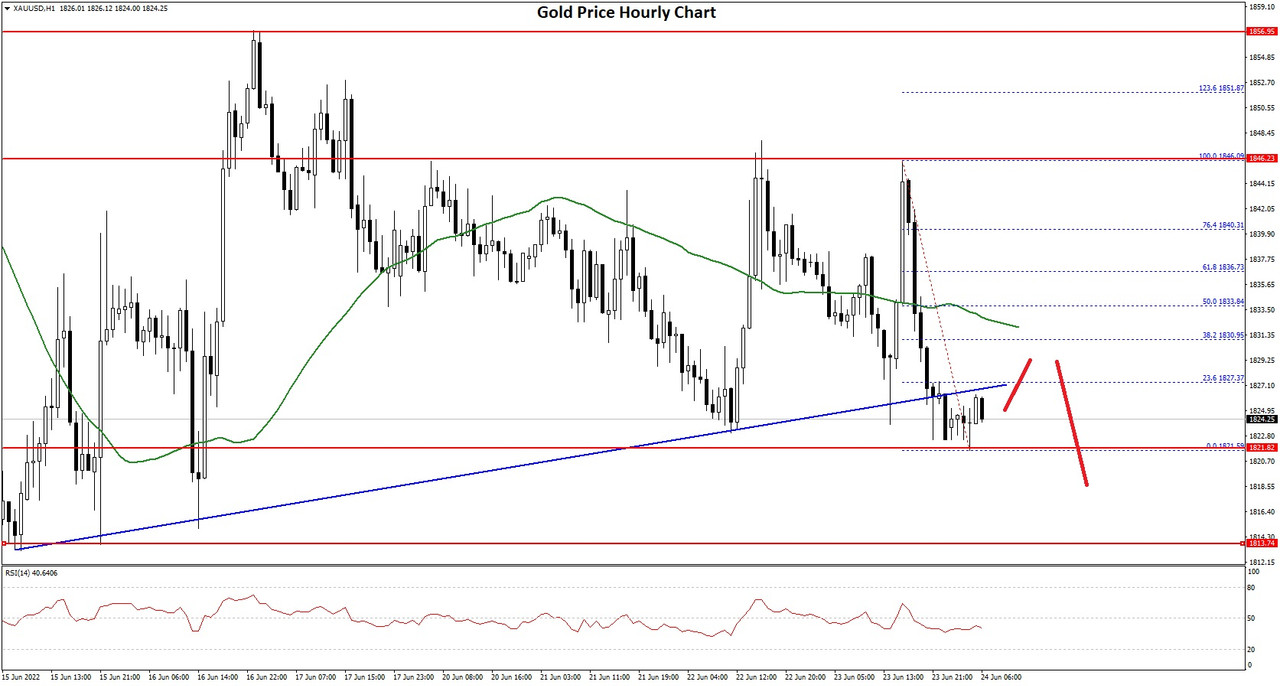
The price traded as low as $1,821 on FXOpen and the price is now consolidating losses. On the upside, the price is facing resistance near the $1,828 level.
The 23.6% Fib retracement level of the downward move from the $1,846 swing high to $1,821 low is also near the $1,828 zone to act as a resistance. The main resistance is now forming near the $1,830 level.
The 50% Fib retracement level of the downward move from the $1,846 swing high to $1,821 low is also near the $1,832 zone. A close above the $1,832 level could open the doors for a steady increase towards $1,850. The next major resistance sits near the $1,860 level.
On the downside, an initial support is near the $1,820 level. The next major support is near the $1,805 level, below which there is a risk of a larger decline. In the stated case, the price could decline sharply towards the $1,780 support zone.
Read Full on FXOpen Company Blog...
GBP/USD Eyes Upside Break While USD/CAD Is Diving
GBP/USD could gain pace if it clears the 1.2320 resistance zone. USD/CAD is sliding and could extend losses below the 1.2870 level.
Important Takeaways for GBP/USD and USD/CAD
The British Pound is attempting an upside correction from the 1.2150 support zone.
There is a key bullish trend line forming with support near 1.2230 on the hourly chart of GBP/USD.
USD/CAD started a fresh decline from the 1.3020 resistance zone.
There was a break below a connecting bullish trend line with support near 1.2960 on the hourly chart.
GBP/USD Technical Analysis
After a downside break, the British Pound found support near the 1.2150 zone against the US Dollar. GBP/USD remained well bid above 1.2150 and recently corrected higher.
A low was formed near 1.2169 on FXOpen and the pair climbed above the 1.2200 resistance zone. There was a clear move above the 1.2250 resistance zone and the 50 hourly simple moving average. The pair even spiked above the 1.2300, but faced sellers near 1.2320.
GBP/USD Hourly Chart
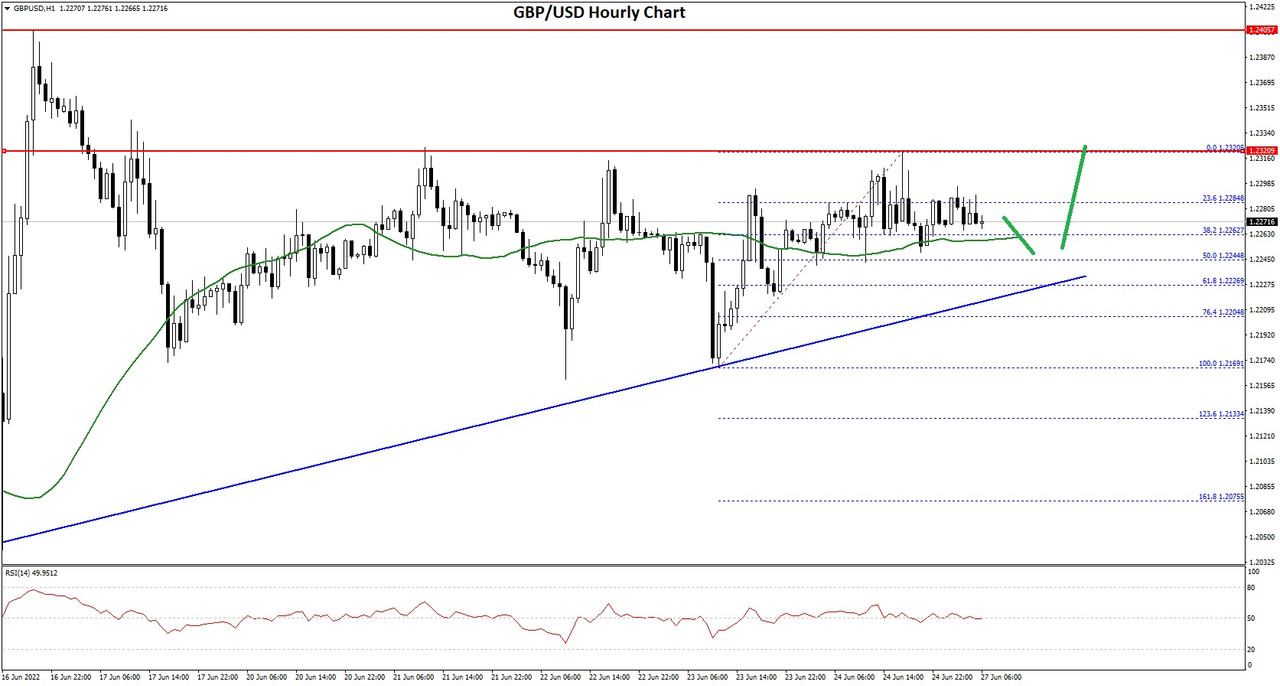
A high is formed near 1.2320 and the pair is now consolidating in a range. There was a test of the 38.2% Fib retracement level of the upward move from the 1.2169 swing low to 1.2320 high.
On the downside, an initial support is near the 1.2260 area. The first major support is near the 1.2240 level. It is near the 50% Fib retracement level of the upward move from the 1.2169 swing low to 1.2320 high.
There is also a key bullish trend line forming with support near 1.2230 on the hourly chart of GBP/USD. If there is a break below 1.2230, the pair could extend its decline. The next key support is near the 1.2180 level. Any more losses might call for a test of the 1.2120 support.
An immediate resistance is near the 1.2300 level. The next key resistance is near the 1.2320 level. If there is an upside break above the 1.2320 zone, the pair could rise towards 1.2400. The next key resistance could be 1.2450, above which the pair could gain strength.
Read Full on FXOpen Company Blog...
The British Pound's weakness harks back to the dark days of the late 1960s
For a number of weeks, the British Pound has been down in the dumps, performing very weakly against its de facto peers, the Euro and the US Dollar.
As this week's trading sessions begin across Europe, the Pound sits at a stagnant 1.16 against the Euro, and an equally mediocre 1.22 against the US Dollar.
The Pound, which remains the world's strongest fiat currency, has been under the microscope of analysts and investors for a few weeks now, and its dull performance is quite interesting considering that the UK did not suffer the same level of government-enforced lockdowns as mainland Europe or parts of the United States did during 2020 and 2021, and its economic burden is devoid of fueling the enormous debt which some member states of the European Union are saddled with, as the United Kingdom is no longer a member of the European Union.
Inflation is playing a major part in the devaluation of currency across the Western world, so therefore by that logic, all majors apart from the Japanese Yen should be in the same position, however the reality is the absolute opposite. The Yen is at a historic low, and the Euro and US Dollar are doing better than the British Pound.
Some pundits have indicated this morning that political woes as well as economic hurdles in the United Kingdom have created an 'investor flight' toward the US Dollar, however there are similar political woes in Europe and the United States, and the populations of both continents each side of the Atlantic face similar cost of living crises as the one in the United Kingdom.
The 'nothing to see here' approach by the British authorities has draw comparisons with the devaluation of the British Pound in 1967, a crisis for the vast majority of citizens, which was dismissed casually by the prime minister of the time Harold Wilson, who claimed quite outrageously that the pound in people's pockets was unaffected.
One possible explanation for the continued depression of the Pound's value could be the current situation in which the workers unions are once again rearing their heads.
Britain's rail networks were blighted by strike action last week, and at a time during which there has been political uncertainty, militant strike action on a national scale harks back to the industrial disasters of the early 1970s, not long after Prime Minister Wilson dismissed the late 1960s devaluation of the pound.
This year alone, the British Pound has decreased in value by 9%, which is a considerable amount, especially when bearing in mind that the Dollar has also been hit by inflation at a 40 year high in the United States, and the US Government's stance against Russia which has led to the US Dollar losing its status as a de facto settlement currency for raw material commodities such as oil and gas which must now be settled in rubles when being purchased from Russian suppliers.
The volatility of late has even spurred an off-the-cuff remark by Bank of America which has likened the British Pound's behavior to that of an emerging market currency!
Of course, that is hyperbole, and the Euro zone is also in a precarious financial position, with a brewing Italian bond crisis and a central bank even more laggardly than our own to raise rates.
The finger-pointing in Britain is now in full swing, however, and the Bank of England's governor is about to be hauled over the coals by the authorities for apparently not doing enough to predict the levels of inflation that are now being experienced.
FXOpen Blog
Euro makes a steady 0.3% gain overnight as Lagarde prepares inflation speech
The Euro is making steady progress at the moment, and has risen by 0.3% during the course of the night, starting the day just above its 50-day moving average.
That represents a strong position for the Euro, which had a value of $1.0578 against the strong US Dollar this morning.
Inflation has been a subject which has dominated not only the news channels recently, but also the everyday lives of a large proportion of the public across both the American and European continents, and this week the matter of rising inflation is on the agenda for announcements from the governments within the important economic centers within the European Union.
On Wednesday this week, Germany will announce its inflation figures, followed by France on Thursday and the Euro Zone as a whole on Friday.
Despite these imminent announcements, the Euro has held its ground very well. The US Dollar has been notably a strong currency against Western majors recently, itself gaining slightly over the Australian Dollar and the Japanese Yen during today's Asian market trading session which takes place in the during the night and early hours of the morning European time. The US Dollar rose to $0.693 against the Australian Dollar and 135.37 Yen would buy 1 US Dollar by the end of the Asian session today, which is close to the seven-year high of 144.24 Yen to the US Dollar which arose las week.
Despite the Dollar's rising value against these two non-Western majors, the Euro still made its ground against the Dollar today, which is remarkable considering the inflation-related announcements which are imminent across Europe.
Of course, the United States is battling with inflation which is at its highest in 40 years, just as is the case across most of the Western world, therefore the announcements in Europe align to some extent with the situation across the Atlantic in the United States.
Today, Christine Lagarde, President of the European Central Bank is due to speak at the European Central Bank forum in Sintra, Portugal at 8.00am GMT, with the anticipated main subject to be inflation.
Interestingly, the Swiss Franc has risen to parity with the Euro this week, largely driven by an interest rate increase by the Swiss National Bank which took place earlier this month, however elsewhere in Europe, the United Kingdom and the United States, the inflation situation is having a profound effect on the buying habits of the public and lifestyle changes have been taking place meaning less spending, and therefore a shrinking economy.
The cost of living has rocketed, meaning that per-capita earnings are less than they were last year by a considerable margin, causing concerns by millions of people as well as analysts and economists over the medium term strength of the Western economy as a whole, therefore some degree of volatility between major currencies, especially the Euro, US Dollar and British Pound has taken place which has over recent years been relatively rare.
Interest rate rises are also making their presence felt as mortgage and loan payments have been increasing across these markets, signaling a potential recession.
There is no magic wand to wave, however listening to central bank announcements, despite their current similarity in tone and content, is a poignant measure of the current state of each sovereign currency.
FXOpen Blog
BTCUSD and XRPUSD Technical Analysis – 28th JUNE 2022
BTCUSD – Bullish Engulfing Pattern Above $19700
Bitcoin continues its bullish momentum this week as the price is moving upside now trading above the $20000 handle in the European Trading session.
We can see a continued consolidation in the levels of Bitcoin after every decline and the prices are now gaining a bullish traction ahead of the US Trading session.
The long-term investors are coming back into the markets as the demands for Bitcoin are increasing due to the increase in global inflation rates.
We can clearly see a Bullish Engulfing Pattern Above the $19700 handle which is a Bullish reversal pattern because it signifies the end of a Downtrend and a shift towards an Uptrend.
Both the STOCH and STOCHRSI are indicating Overbought levels which means that in the immediate short term a decline in the prices is expected.
Relative Strength Index is at 49 indicating a NEUTRAL demand for the Bitcoin at the current market levels.
Bitcoin is now moving Below its 100 hourly Simple Moving average and its 200 hourly Simple Moving averages.
All of the Major Technical Indicators are giving a STRONG BUY Signal, which means that in the immediate short term we are expecting targets of 21500 and 23000.
Average True Range is indicating LESS Market Volatility with a Bullish Momentum.
Bitcoin continues Bullish Momentum Above $19700.
Williams Percent Range is Indicating OVERBOUGHT Levels.
The price is now trading just Above its Pivot Levels of $20834.
All of the Moving Averages are giving a BUY market signal.
Bitcoin Continues Bullish Momentum Above $19700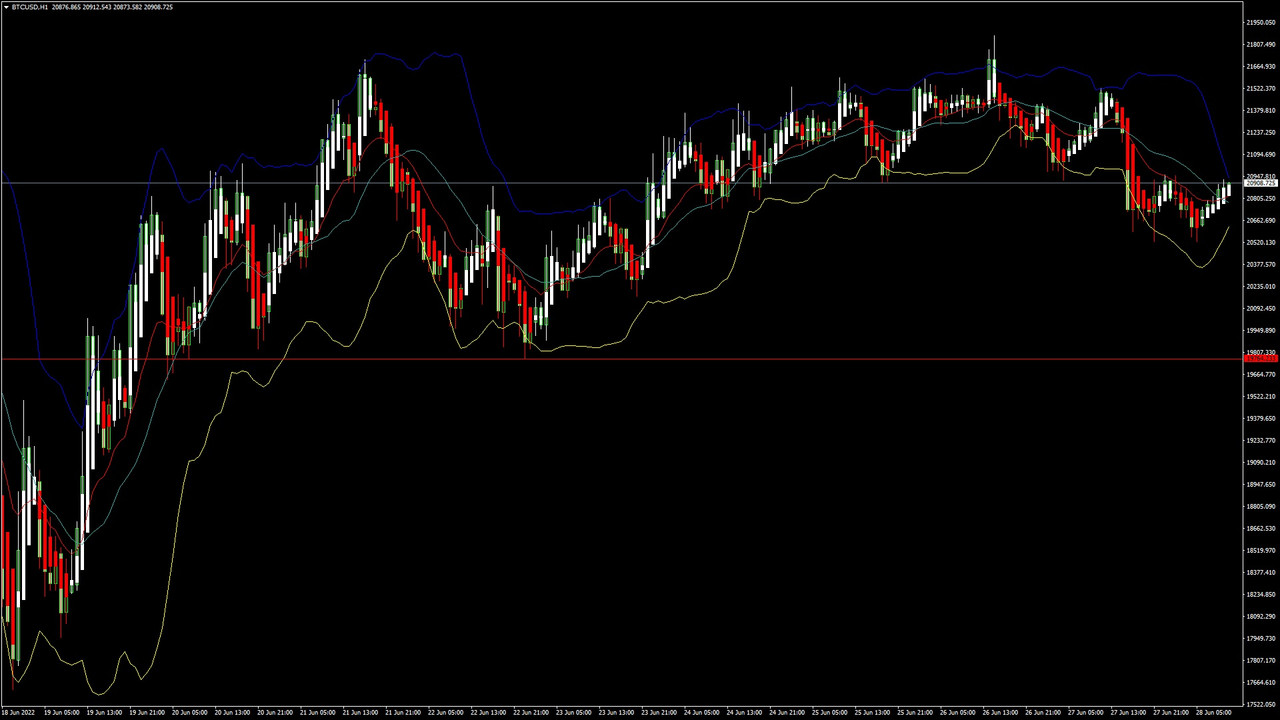
The prices of Bitcoin have entered into a consolidation channel above the $20000 handle and the continuation of the bullish momentum above the $20500 levels.
The global sentiments have improved and now the prices are forming an Ascending Triangulation pattern and a short-term rally above $22000 is expected.
We can see a close co-relation between the movement of prices in Bitcoin and Nasdaq 100 index.
The immediate short-term outlook for Bitcoin is Bullish, Medium-term outlook has turned as Neutral, and the long-term outlook remains Neutral under present market conditions.
Bitcoin is now facing resistance below $22000 as it failed to clear it on 26th June after touching a high of $21865.
The price of BTCUSD is now facing its Classic resistance levels of 20936 and Fibonacci resistance levels of 20998 after which the path towards 22000 will get cleared.
In the last 24hrs BTCUSD has decreased by 2.35% by 502$ and has a 24hr trading volume of USD 21.622 Billion. We can see an Increase of 6.09% in the Trading volume as compared to yesterday, which appears to be Normal.
The Week Ahead
The prices of Bitcoin are moving in a Bullish momentum and the immediate targets are $21500 and $22500
The Daily RSI is printing at 34 which means that the medium range demand continues to be WEAK.
We can see that the prices of Bitcoin have stabilized above the $20000 handle and now we are looking at the important support levels of $21045 and $21599.
The prices of BTCUSD will need to remain above the important support levels of $20000 this week.
Weekly outlook is projected at $22500 with a consolidation zone of $21500.
Technical Indicators:
Average Directional Change(14days): It is at 41.40 indicating a BUY.
Ultimate Oscillator: It is at 56.99 indicating a BUY.
Rate of Price Change: It is at 0.341 indicating a BUY.
Commodity Channel Index(14days): It is at 111.24 indicating a BUY.
Read Full on FXOpen Company Blog...
EUR/USD and USD/CHF At Risk of More Losses
EUR/USD started another decline and traded below 1.0550. USD/CHF is consolidating and facing many hurdles near the 0.9580 zone.
Important Takeaways for EUR/USD and USD/CHF
The Euro failed to gain pace for a move above the 1.0600 resistance zone against the US Dollar.
There was a break below a major bullish trend line with support near 1.0550 on the hourly chart of EUR/USD.
USD/CHF also started a fresh decline after it failed to clear the 0.9700 resistance zone.
There is a key bearish trend line forming with resistance near 0.9565 on the hourly chart.
EUR/USD Technical Analysis
This past week, the Euro gained pace above the 1.0550 resistance zone against the US Dollar. The EUR/USD pair climbed above the 1.0580 resistance zone to move into a bullish zone.
The pair attempted a clear move above the 1.0600 resistance, but the bears remained active. The recent high was formed near 1.0615 before the pair started a fresh decline. The price declined below the 1.0550 level.
EUR/USD Hourly Chart
There was a break below a major bullish trend line with support near 1.0550 on the hourly chart of EUR/USD. The pair traded as low as 1.0503 on FXOpen and settled below the 50 hourly simple moving average.
It is now consolidating near 23.6% Fib retracement level of the recent decline from the 1.0615 swing high to 1.0503 low. An immediate resistance is near the 1.0540 level.
The next major resistance is near the 1.0560 level. It is close to the 50% Fib retracement level of the recent decline from the 1.0615 swing high to 1.0503 low. A clear move above the 1.0560 resistance zone could set the pace for a larger increase towards 1.0600. The next major resistance is near the 1.0650 zone.
On the downside, an immediate support is near the 1.0520 level. The next major support is near the 1.0500 level. A downside break below the 1.0500 support could start another decline.
Read Full on FXOpen Company Blog...